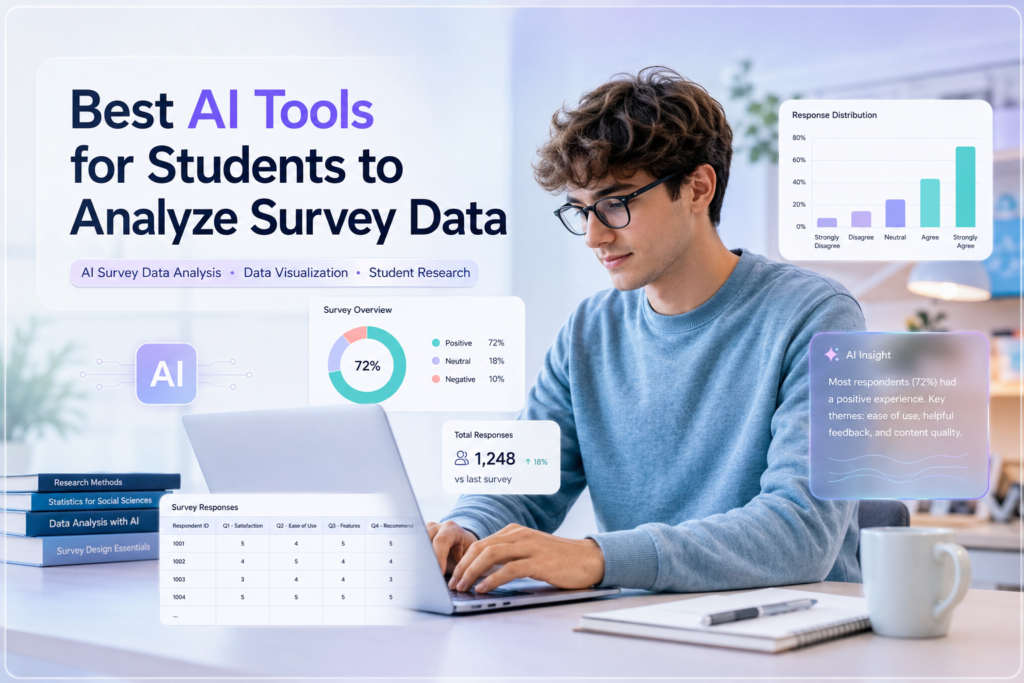
Quick Answer
The Best AI Tools for Students to Analyze Survey Data can help organize responses, clean messy datasets, summarize patterns, create charts, explain basic statistics, and analyze open-ended answers. Tools such as ChatGPT, Google Gemini, Excel, and Google Sheets can support different stages of the process, but students must verify calculations, protect participant privacy, and base every finding on their actual survey data.
Introduction
You collected the survey responses.
Now comes the part that often takes much longer than expected: figuring out what all those responses actually mean.
A spreadsheet that looked manageable when you created the survey can quickly become difficult to understand once dozens or hundreds of responses start filling the rows.
You may need to determine:
• Which responses are most common
• Whether some questions have missing answers
• How different groups responded
• What patterns appear across questions
• Which results are worth highlighting
• How to turn numbers into useful charts
• How to analyze written responses
• Which statistics are appropriate
• How to explain the findings without overstating them
For a class project, research paper, capstone, thesis, or business assignment, this process can become surprisingly time-consuming.
The challenge is not always collecting the data.
It is turning the collected data into reliable findings.
This is where AI can become useful.
Modern AI tools can help students organize survey responses, identify obvious data problems, calculate descriptive statistics, explore patterns, categorize open-ended answers, recommend visualizations, and explain analytical concepts in simpler language.
But there is an important distinction.
AI can assist with survey analysis.
It should not be allowed to invent the analysis.
If 63 students selected an answer, AI should not turn that into 70 because a different number seems more convenient. If respondents give mixed opinions, AI should not hide the disagreement to create a cleaner story. And if a survey does not support a particular conclusion, an AI tool should not manufacture one.
The strongest workflow therefore starts with the student’s actual dataset.
A reliable AI-assisted survey workflow keeps your original research evidence at the center of every stage.
That distinction matters throughout this guide.
What This Guide Covers
This guide is designed to help students understand the complete survey-analysis process—not simply choose an AI tool from a list.
You will also see why different tools are useful for different tasks.
A practical place to preserve, inspect, organize, and verify your dataset.
Useful for exploring patterns, explaining calculations, and organizing findings.
Helpful when you need academic context or background information.
More appropriate when your project requires advanced statistical methods.
The goal is not to use as many AI tools as possible. The goal is to build a workflow in which each tool has a clear job.
Survey data often combines several types of information.
Each type of response can require a different approach.
For example, counting how many students selected each multiple-choice answer is relatively straightforward.
Analyzing hundreds of written responses is different. Comparing two groups requires another type of analysis. And deciding whether a relationship between two variables is meaningful requires more than simply asking an AI chatbot to find a pattern.
Survey data often combines several types of information.
You might have:
Each type of response can require a different approach.
For example, counting how many students selected each multiple-choice answer is relatively straightforward.
Analyzing hundreds of written responses is different. Comparing two groups requires another type of analysis. And deciding whether a relationship between two variables is meaningful requires more than simply asking an AI chatbot to find a pattern.
This is why a responsible AI survey data analysis workflow begins by understanding the data before asking AI to interpret it.
One of the biggest mistakes students can make is asking an AI tool a vague question such as:
That request gives the AI too much freedom.
A better approach is to break the analysis into smaller, verifiable tasks.
This approach makes the process easier to check.
Instead of treating AI as an automatic research analyst, you are using it as an assistant that helps you work through specific analytical questions.
That is the approach this guide follows.
AI survey data analysis is the use of artificial intelligence to assist with organizing, cleaning, summarizing, exploring, visualizing, and interpreting survey responses.
A survey dataset might contain hundreds or thousands of individual responses. AI can help students work through repetitive tasks more efficiently, especially when the dataset contains a mixture of structured responses and written comments.
For example, AI can assist with:
However, AI survey analysis does not mean that AI automatically knows what your research results mean.
That distinction is important.
For many student projects, the first stage is descriptive analysis.
Descriptive analysis answers questions such as:
This helps describe what happened in the collected dataset.
Deeper statistical analysis may ask different questions, such as whether variables are associated, whether groups differ in a statistically meaningful way, or whether a particular statistical model is appropriate.
Those questions require more methodological knowledge.
AI can explain statistical concepts and assist with calculations, but students should not assume that an AI-generated statistical test is appropriate simply because the tool can perform it.
The research question, survey design, variables, sample, and analytical assumptions all matter.
A useful way to think about AI survey analysis is:
That means students should preserve their original data, verify important calculations, inspect AI-generated patterns, and make sure their final findings accurately represent the survey responses.
If AI identifies an interesting pattern, treat it as something to investigate—not automatically as a conclusion.
What Can AI Do With Survey Data?
AI can support many stages of the survey-analysis workflow, but its role should be clearly defined at each stage.
| Survey Analysis Task | How AI Can Help | Human Verification Needed |
|---|---|---|
| Data organization | Structure columns, categorize responses, suggest cleanup | Yes |
| Data cleaning | Identify missing, inconsistent, or unusual entries | Absolutely |
| Duplicate detection | Flag possible duplicate records | Yes |
| Missing-value identification | Locate incomplete responses | Yes |
| Response categorization | Group similar categories or answers | Yes |
| Open-ended responses | Identify recurring themes and summarize comments | Absolutely |
| Pattern identification | Surface possible trends or differences | Yes |
| Descriptive statistics | Calculate or explain basic measures | Absolutely |
| Cross-tabulation | Compare categories or groups | Yes |
| Chart recommendations | Suggest appropriate visualizations | Yes |
| Data visualization | Create charts from structured data | Yes |
| Interpretation support | Explain what verified numbers may indicate | Absolutely |
| Report drafting | Organize verified findings into clearer language | Yes |
The important word throughout this table is assist.
AI can accelerate the work, but students should remain involved in decisions that affect the integrity of the research.
Data Organization
AI can help turn a messy spreadsheet into a more understandable structure.
For example, it may identify inconsistent category labels such as:
Those values may refer to the same category, but they should not automatically be merged without understanding how the survey was designed.
Data Cleaning
AI can identify potential problems in a dataset.
It may flag:
The student should decide what to do with those records.
An unusual response is not automatically an incorrect response.
Open-Ended Response Analysis
This is one of the areas where AI can save considerable time.
Suppose a student receives hundreds of written answers to:
AI can help group responses into potential themes such as:
But those categories should be reviewed against the original responses. AI-generated themes are a starting point for analysis—not automatically the final coding framework. Recent research-oriented discussions of AI-assisted survey analysis similarly emphasize reviewing and refining AI-generated themes against the raw responses.
Pattern Identification
AI can help students notice potential relationships or differences that deserve investigation.
That may be a useful observation.
But it does not automatically prove:
Correlation and causation are different concepts.
Visualization
AI can help students determine how to display survey results.
The goal should always be to make the evidence easier to understand. A visually impressive chart is not necessarily a useful chart.
Report Drafting
After the analysis has been verified, AI can help turn the findings into clearer academic language.
For example:
This is safer than asking:
The first instruction constrains AI to the verified evidence.
The second gives it much more freedom to invent interpretations.
That difference is central to responsible AI tools for students to analyze survey data.
Why Students Use AI to Analyze Survey Data
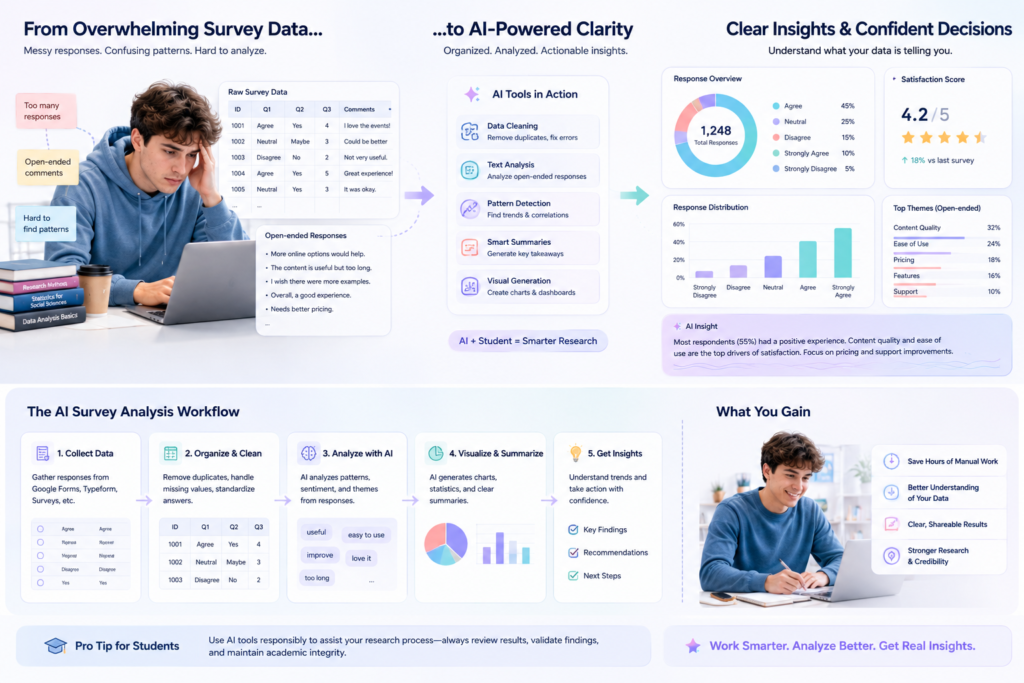
Collecting survey responses is only the beginning. Once the responses are available, students often face a second challenge: turning a large amount of information into something they can actually understand and explain.
AI can reduce some of the repetitive work involved in this process. Instead of manually reviewing every row or calculating every basic percentage, students can use AI to assist with specific analytical tasks while keeping control of the research process.
Handling Large Numbers of Responses
A survey with 20 responses can be reviewed manually without much difficulty.
A survey with 500 or 1,000 responses is different.
Large datasets can contain hundreds of rows, multiple questions, missing answers, inconsistent entries, and open-ended comments. Manually inspecting everything can take considerable time.
AI can help students summarize large datasets and identify areas that deserve closer attention.
For example, a student could ask an AI tool to:
The student should still inspect the underlying dataset before treating those outputs as findings.
Organizing Messy Survey Data
Survey data does not always arrive in a perfectly organized format.
Students may encounter:
AI can help identify these problems and suggest ways to organize the dataset.
However, suggesting a correction is not the same as making a correction safely.
For example, if two categories appear similar, the student should confirm that they actually represent the same response before combining them.
Always preserve an untouched copy of the original dataset.
Understanding Open-Ended Responses
Written survey responses can be one of the most time-consuming parts of a student research project.
Imagine receiving several hundred answers to an open-ended question.
Reading every response is important, but AI can help with the initial organization.
It can potentially:
The original responses should remain available throughout the process.
If AI identifies a theme such as “time management,” the student should review actual responses that were placed into that category.
This helps prevent the tool from oversimplifying nuanced answers or overlooking less common perspectives.
Finding Patterns
Students often want to know whether their survey contains meaningful patterns.
AI can help surface possible relationships between variables.
That observation can be useful.
But it does not automatically establish causation.
The student should ask:
AI should help generate questions for further analysis rather than automatically deciding what the research proves.
Creating Visualizations
Charts can make survey findings easier to understand, especially when a dataset contains many categories.
AI can help students determine whether a bar chart, stacked chart, histogram, table, or another visualization may be appropriate.
The important question is not:
It is:
Students should always check the final visualization for:
Understanding Basic Statistics
Statistics can feel intimidating when students encounter concepts such as mean, median, standard deviation, correlation, or cross-tabulation for the first time.
AI can explain these concepts in plain language and demonstrate how they relate to a student’s dataset.
For example, a student might ask:
This can be more helpful than simply asking AI to calculate a number.
The student learns what the statistic means rather than treating the output as a mysterious result.
Writing Findings Clearly
After analysis is complete, students still need to communicate what they discovered.
AI can help turn verified numbers into clearer academic language.
For example:
This type of instruction limits unnecessary invention.
Students should provide the verified findings rather than asking AI to independently invent the findings section.
Saving Time on Repetitive Analysis
One of the strongest reasons students use AI is to reduce repetitive work.
Tasks such as counting categories, organizing responses, summarizing repeated comments, or explaining basic calculations can consume time without necessarily requiring advanced research judgment.
AI can help make those tasks faster.
But saved time should be redirected toward verification and interpretation, not toward skipping those stages.
The best AI tools for students to analyze survey data are therefore not necessarily the tools that automate the most work. They are the tools that make useful analysis easier while keeping the student involved in important research decisions.
How We Selected These AI Survey Analysis Tools
A useful survey-analysis tool should not be judged simply by how impressive its AI features sound.
Students need tools that fit their actual workflow, support their data format, provide understandable outputs, and make it possible to verify important results.
For this guide, tools are evaluated according to their usefulness across different stages of student survey analysis.
Data Analysis Capability
The first question is whether the tool can meaningfully work with structured survey data.
A useful tool should be able to assist with tasks such as:
General-purpose AI assistants can be useful here, but they should not automatically be treated as replacements for dedicated statistical software.
Ease of Use
Students should not need advanced programming knowledge just to perform basic survey analysis.
A tool earns additional value when students can understand its workflow and interpret its outputs without unnecessary technical complexity.
Ease of use matters particularly for:
Visualization Support
Survey analysis often becomes much clearer when results are visualized properly.
We consider whether a tool can help students:
A tool should not be recommended simply because it can create attractive graphics.
Statistical Support
Students may need help with:
The key consideration is whether the tool can explain these concepts and support appropriate calculations without encouraging students to use statistics they do not understand.
Open-Ended Response Analysis
Many student surveys contain qualitative questions.
A useful AI tool should be able to assist with:
Human review is particularly important here because automated categorization can miss context, minority viewpoints, sarcasm, or contradictory responses.
Student Value
A powerful research platform is not automatically the best choice for every student.
We consider whether a tool provides meaningful value relative to:
Accuracy and Verification
No AI system should be treated as automatically correct.
Tools are evaluated with the assumption that important outputs require verification.
This includes:
The ability to verify an output is just as important as the ability to generate it.
File/Data Support
Students commonly work with files such as spreadsheets and exported survey datasets.
The practical usefulness of a tool depends partly on how easily students can provide data in a supported format and inspect the resulting analysis.
Students should always check the tool’s current file and data capabilities before relying on it for a specific project.
Privacy
Survey datasets can contain sensitive information.
A tool should not be judged only on analytical capabilities.
Students should also consider:
Sensitive participant information should not be uploaded unnecessarily.
Free Availability
Many students have limited budgets.
Free access can make a tool much more practical for class projects, although free plans may have restrictions on features, usage, file uploads, or advanced capabilities.
Pricing and plan details can change, so students should verify current information before choosing a tool.
Academic Usefulness
Finally, the tool should actually help students conduct better research.
The ideal tool supports a workflow such as:
Rather than encouraging students to skip directly from raw responses to an automatically generated conclusion.
This evaluation approach is why the Best AI Tools for Students to Analyze Survey Data are presented according to specific student tasks rather than as a simple ranking.
Best AI Tools for Students to Analyze Survey Data
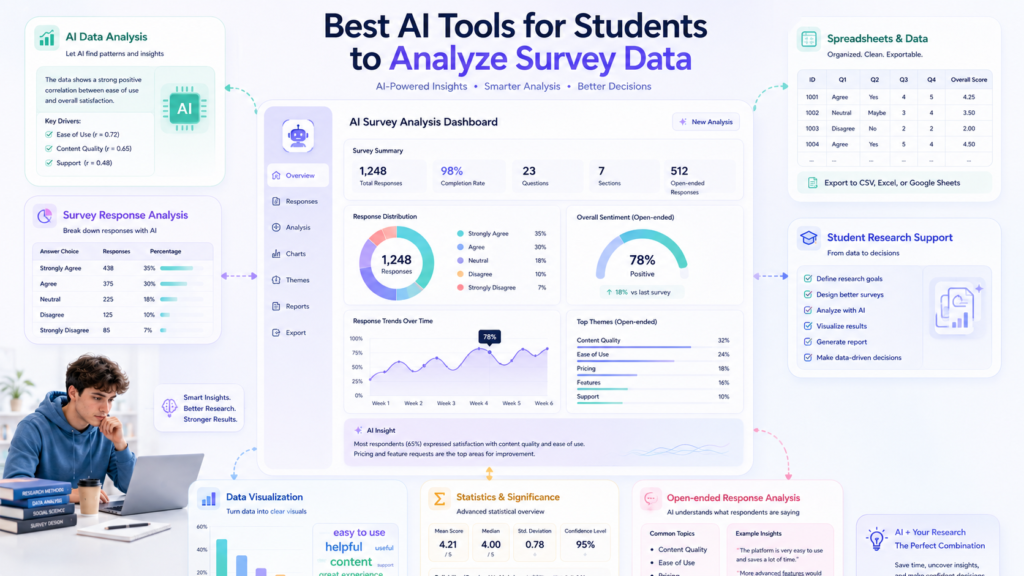
There is no single AI tool that is perfect for every survey project.
The right choice depends on the size of the dataset, the type of questions, the level of analysis required, and how much control the student wants over the workflow.
For many students, a combination of a spreadsheet and a general-purpose AI assistant can be more practical than relying on one platform for everything.
The following tools are selected based on their relevance to different stages of survey analysis.
ChatGPT
Overview
ChatGPT is a general-purpose AI assistant that can support several parts of the survey-analysis workflow when students provide appropriate data and clear instructions.
It can be useful for exploring structured datasets, explaining calculations, identifying potential patterns, organizing information, and helping students understand analytical concepts.
Its biggest strength is flexibility. Rather than being limited to one type of survey task, it can move between data organization, explanation, interpretation support, and writing.
Best For
Key Features
Depending on the current plan and available capabilities, ChatGPT can work with uploaded information and assist with data-related tasks. Students can use it to ask questions about their dataset instead of manually writing every calculation or analytical instruction.
The exact capabilities available to a student can vary by account and plan, so current feature availability should be checked before use.
How Students Can Use It for Survey Data
A student might provide an anonymized dataset and ask:
After reviewing the output, the student could continue with a narrower question:
For open-ended responses, students could ask AI to suggest themes and then manually compare those themes with the original answers.
Pros
Cons
Pricing / Free Option
ChatGPT offers free access as well as paid plans with different capabilities and limits. Current features, limits, and pricing should be checked on the official OpenAI website before publication or purchase.
Check Official ChatGPT Plans & Pricing →Ideal Student Type
Students who want one flexible assistant to help them understand, explore, and communicate survey data.
Real Student Scenario
A university student has collected responses for a class survey about study habits.
The student first cleans and organizes the spreadsheet, removes unnecessary identifying information, and preserves the original dataset.
They then use ChatGPT to summarize response frequencies, explain basic statistics, and identify possible patterns worth investigating.
The student checks the calculations against the source dataset before writing the findings.
Important Limitation
ChatGPT should not be treated as an unquestionable statistical authority. A generated number, pattern, or interpretation can be wrong. Students remain responsible for checking the analysis against their actual data and research methodology.
Google Gemini
Overview
Google Gemini is a general-purpose AI assistant that can help students with information analysis, explanations, writing, and workflows involving Google’s broader ecosystem.
For survey projects, it can be useful when students already organize their work through Google Sheets and other Google services.
Best For
Gemini can be useful for:
Key Features
Its usefulness depends on the current Gemini experience, account type, connected Google products, and available features.
Students should verify current capabilities before assuming that a particular data-analysis or spreadsheet feature is available to them.
How Students Can Use It for Survey Data
A student can use Gemini to understand a dataset, ask questions about response patterns, or explain a statistical concept.
For example:
Students can also use it to improve the wording of a findings section after independently verifying the numbers.
Pros
Cons
Pricing / Free Option
Gemini has free access options as well as paid offerings with additional capabilities. Current availability and pricing should be verified before publication.
Visit Official Google Gemini →Ideal Student Type
Students who already use Google Workspace or Google Sheets and want AI assistance within that broader workflow.
Real Student Scenario
A college student exports survey responses into a spreadsheet and uses Gemini to help understand response distributions and identify questions that may require further investigation.
The student then checks those observations directly against the spreadsheet before including them in a research report.
Important Limitation
Gemini should not independently determine what a survey proves. Students must verify calculations, research methods, and interpretations.
Claude
Overview
Claude is a general-purpose AI assistant that can be useful for analyzing and explaining information, reviewing text, and helping students reason through survey findings.
It can be particularly useful when a student needs detailed explanations rather than simply a numerical output.
Best For
Key Features
Claude’s current capabilities can vary by plan and product environment.
For survey work, its value is particularly strong when students need help interpreting or organizing text-heavy responses while keeping the original dataset available for verification.
How Students Can Use It for Survey Data
Students can provide anonymized open-ended responses and ask Claude to propose a preliminary coding structure.
For example:
The student should then review the proposed categories against the original responses.
Pros
Cons
Pricing / Free Option
Claude provides free and paid access options, with current limits and features varying by plan. Verify current pricing and availability before publication.
Check Official Claude Plans & Pricing →Ideal Student Type
Students dealing with substantial open-ended survey responses or projects where qualitative interpretation is important.
Real Student Scenario
A psychology student receives hundreds of written responses about academic stress.
Instead of asking AI to produce the final findings, the student asks Claude to suggest preliminary themes, reviews the original responses, adjusts the categories, and then uses the verified coding framework for the final analysis.
Important Limitation
AI-generated themes should never be treated as automatically valid research findings. The student must inspect the underlying responses and explain how the categories were developed.
Best AI Tool by Survey Analysis Task
There is no single tool that is automatically best for every survey-analysis job. The right choice depends on what you are trying to accomplish, what type of data you collected, and how much statistical work your project requires.
A simple class survey may only need a spreadsheet and an AI assistant. A thesis or capstone project may require more specialized statistical software and a clearly documented methodology.
The goal is to match the task to the tool rather than choosing a tool simply because it has the most AI features.
Survey Analysis Task Comparison
| Survey Analysis Task | Recommended Tool | Why | Verification Required |
|---|---|---|---|
| Cleaning survey data | Excel / Google Sheets + AI assistance | Easy to inspect and organize | ✓ Yes |
| Summarizing responses | ChatGPT / Gemini | Fast response summaries | ✓ Yes |
| Multiple-choice analysis | Excel / Google Sheets | Strong for counts and percentages | ✓ Yes |
| Likert-scale analysis | Excel / Sheets + AI | Useful for distributions and explanations | ✓ Yes |
| Open-ended responses | Claude / ChatGPT | Useful for preliminary themes | ⚠ Absolutely |
| Creating charts | Excel / Google Sheets | Direct control over visualizations | ✓ Yes |
| Finding patterns | ChatGPT / Gemini / Claude | Useful exploratory assistance | ✓ Yes |
| Comparing groups | Excel / Sheets + AI | Flexible for cross-tabulation | ✓ Yes |
| Basic statistics | Excel / Sheets + AI | Accessible for students | ⚠ Absolutely |
| Explaining results | ChatGPT / Claude / Gemini | Clear natural-language explanations | ✓ Yes |
| Writing findings | ChatGPT / Claude | Useful after results are verified | ✓ Yes |
Important: AI can assist with survey analysis, but important calculations, patterns, categories, and interpretations should always be checked against the original dataset.
Cleaning Survey Data
For basic data cleaning, spreadsheets remain extremely useful because students can directly inspect the rows and columns.
AI can assist by identifying possible inconsistencies, but the student should make the final decision about whether a value is actually incorrect.
Summarizing Survey Responses
General-purpose AI assistants can quickly summarize response distributions and identify frequently occurring answers.
This is particularly useful when students have many questions and need an initial overview before conducting deeper analysis.
Analyzing Multiple-Choice Responses
Spreadsheet tools are often the simplest option for multiple-choice questions.
Students can calculate:
• Frequencies
• Percentages
• Category distributions
AI can then help explain what those numbers mean in plain language.
Analyzing Likert-Scale Responses
Likert-scale questions require more care than simply treating every response as an ordinary number.
Students should first understand how their scale is defined—for example, whether 1 means “Strongly Disagree” and 5 means “Strongly Agree.”
AI can help summarize distributions and explain concepts, but the appropriate statistical treatment depends on the research design and analytical goal.
Creating Charts
Excel and Google Sheets provide students with direct control over charts.
AI can help recommend a suitable visualization, but students should inspect the final chart themselves.
Finding Trends
AI can help identify potential patterns across questions or groups.
Treat these observations as hypotheses to investigate rather than automatically established findings.
Comparing Groups
Cross-tabulation can help students compare responses between categories such as:
• First-year vs. senior students
• Undergraduate vs. graduate students
• Different age groups
• Different study programs
The comparison should be based on the research question rather than performed simply because the data makes it possible.
Basic Statistical Calculations
AI can explain and assist with calculations involving:
• Mean
• Median
• Mode
• Frequency
• Percentage
• Standard deviation
Important calculations should be independently checked.
Explaining Results
Once the numbers have been verified, AI can help students explain them clearly.
For example:
“Explain these verified survey results in beginner-friendly academic language. Do not add claims that are not supported by the provided data.”
Writing Findings
AI can help transform verified results into a structured findings section.
The student should provide the actual numbers and conclusions rather than asking AI to invent a complete analysis from scratch.
This task-based approach is central to choosing the Best AI Tools for Students to Analyze Survey Data because the strongest workflow uses different tools where they are most useful.
Best AI Tool by Student Situation
Students do not all have the same survey project.
A high school student analyzing 75 responses for a class assignment has very different needs from a graduate student working with a large research dataset.
Student With 50–100 Survey Responses
A small survey dataset is usually manageable with a spreadsheet plus a general AI assistant.
Problem: You have enough responses to make manual counting tedious but not enough data to justify an overly complicated workflow.
Recommended approach: Use Excel or Google Sheets to preserve and inspect the dataset, then use AI to explain distributions, identify obvious patterns, and help draft verified findings.
Why: This keeps the process simple and transparent.
Student With Hundreds of Responses
Larger datasets create more opportunities for inconsistent values, missing responses, and duplicate records.
Problem: Manually checking every response becomes difficult.
Recommended approach: Begin with spreadsheet-based organization and cleaning. Use AI for exploratory analysis and summarization.
Why: The spreadsheet remains your source of truth while AI reduces repetitive work.
Student Analyzing Open-Ended Answers
Written responses require a different workflow.
Problem: Hundreds of comments can be difficult to categorize manually.
Recommended approach: Use ChatGPT or Claude to propose preliminary themes, then compare those themes against the original responses.
Why: AI can accelerate initial categorization, while human review protects against oversimplification.
Student Working on a Business Project
Business surveys often involve customer preferences, satisfaction, product opinions, or purchasing behavior.
Problem: Students need to turn response distributions into practical findings.
Recommended approach: Use spreadsheets for calculations and charts, then use AI to help explain verified patterns.
Why: This combination provides both numerical control and writing assistance.
Psychology or Social Science Student
Psychology and social science surveys may contain rating scales, demographic variables, and open-ended responses.
Problem: The dataset may require both quantitative and qualitative analysis.
Recommended approach: Use a combination of spreadsheet tools, AI-assisted qualitative organization, and appropriate statistical methods.
Why: Different parts of the dataset may require different analytical approaches.
STEM Student
STEM surveys may include numerical measurements, ratings, categorical variables, or technical questions.
Problem: Students may be tempted to focus on calculations without considering the research question.
Recommended approach: Define the research question first, organize the variables carefully, and use AI to explain calculations and explore patterns.
Why: The analytical method should follow the research question rather than the capabilities of the AI tool.
MBA Student
MBA students often analyze surveys involving customer behavior, employee satisfaction, leadership, marketing, or business preferences.
Problem: The challenge may be turning survey results into a concise business interpretation.
Recommended approach: Use spreadsheets for the underlying analysis and AI for summarization, visualization suggestions, and clear reporting.
Why: This approach balances quantitative evidence with practical communication.
Thesis or Capstone Student
Larger academic projects require more methodological discipline.
Problem: The consequences of an incorrect analytical decision can be much greater than in a simple class assignment.
Recommended approach: Use AI as a supporting tool rather than the primary statistical authority. Document the analytical process and verify important results with appropriate methods or software.
Why: Thesis and capstone projects may require stronger methodological justification and reproducibility.
Beginner Who Has Never Analyzed Data Before
Beginners often need explanations more than automation.
Problem: Statistical terminology can make the analysis process confusing.
Recommended approach: Ask AI to explain concepts step by step, then perform or verify the calculations using a spreadsheet.
Why: Learning what a statistic means is more valuable than simply receiving a number.
How to Analyze Survey Data With AI Step by Step
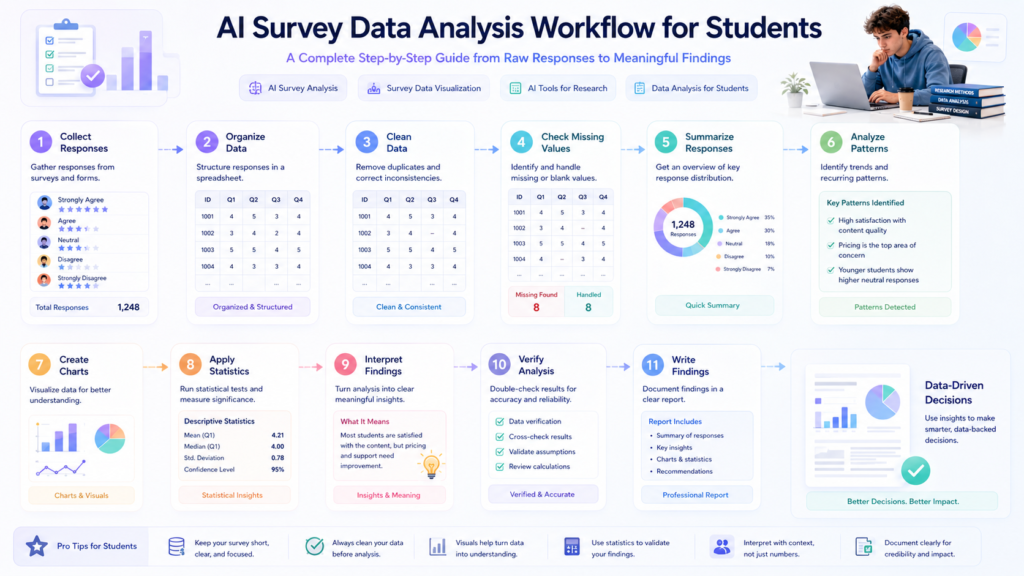
The strongest approach is to treat survey analysis as a sequence of controlled stages.
Do not upload a dataset and immediately ask AI to “tell me what it means.”
Instead, move through the analysis one step at a time.
Step 1 — Collect Responses
Start with your actual survey responses.
Make sure you understand:
• What population you surveyed
• How responses were collected
• What each question measures
• Which questions are required
• Which responses may be incomplete
AI cannot fix weaknesses in the original survey design.
Step 2 — Export and Organize Data
Export your responses into a structured format such as a spreadsheet.
Each row should generally represent a response, while columns represent survey questions or variables.
Before using AI, make sure the structure is understandable.
Step 3 — Remove Obvious Data Problems
Work from a copy of the original dataset.
Look for:
• Empty fields
• Invalid values
• Inconsistent categories
• Formatting problems
• Possible duplicates
Do not permanently alter the raw dataset simply because an AI tool recommends a change.
Step 4 — Check Missing or Duplicate Responses
Determine how incomplete responses should be handled.
A blank answer may represent a skipped question rather than an error.
Likewise, two similar responses are not automatically duplicates.
Investigate before removing anything.
Step 5 — Summarize the Responses
Begin with descriptive analysis.
Calculate or review:
• Frequencies
• Percentages
• Mean
• Median
• Mode
• Response distributions
This gives you a basic understanding of what the dataset contains.
Step 6 — Analyze Patterns and Groups
Now investigate the relationships that matter to your research question.
You might compare:
• Different demographic groups
• Different response categories
• Different survey questions
• High and low ratings
Do not search for relationships simply because they are available.
Step 7 — Create Charts
Choose charts based on the type of data.
Check:
• Labels
• Values
• Categories
• Axes
• Titles
• Percentages
Every chart should help answer a research question or communicate an important finding.
Step 8 — Perform Appropriate Statistical Analysis
Only use statistical methods that fit your research question and data.
For a basic class survey, descriptive statistics may be sufficient.
A more advanced project may require additional statistical methods.
If you are unsure which method is appropriate, consult your instructor, research supervisor, or a qualified statistics resource rather than blindly following an AI recommendation.
Step 9 — Interpret Findings
Ask what the verified results actually show.
Separate:
What the data shows
from
What you think might explain it.
This prevents students from turning an observed association into an unsupported causal claim.
Step 10 — Verify the Analysis
Return to the original dataset.
Check:
• Counts
• Percentages
• Sample size
• Categories
• Calculations
• Statistical methods
• AI-generated themes
• Outliers
• Reported patterns
This is one of the most important stages in the entire workflow.
Step 11 — Write the Findings
Only after verification should you write the final findings section.
AI can help improve the wording, but the content should come from the verified analysis.
A useful instruction is:
“Write this findings section using only the verified results I provide. Do not invent explanations, statistics, or conclusions.”
This workflow keeps the student in control while using AI where it provides genuine efficiency.
How to Analyze Different Types of Survey Questions
Different question formats produce different types of data.
Before choosing an analytical method, identify what kind of response each question produces.
Multiple-Choice Questions
Multiple-choice questions are often straightforward to summarize.
Useful outputs include:
• Frequency counts
• Percentages
• Bar charts
• Group comparisons
For example, if respondents select their preferred study method, a frequency table can show how many students chose each option.
Likert-Scale Questions
Likert questions typically measure attitudes or levels of agreement.
A common structure might range from:
Strongly Disagree → Disagree → Neutral → Agree → Strongly Agree
Students can summarize:
• Response frequencies
• Percentages
• Distribution
• Median or other appropriate descriptive measures
The correct treatment depends on the research design and how the scale is being used.
Yes/No Questions
Binary questions can usually be summarized using counts and percentages.
For example:
Yes: 72%
No: 28%
A simple bar chart may communicate this clearly.
Ranking Questions
Ranking questions ask respondents to place options in order.
Students may need to calculate:
• Average rank
• Frequency of first-place choices
• Distribution of rankings
The appropriate summary depends on how the ranking question was designed.
Rating Questions
Rating questions commonly ask respondents to evaluate something on a numerical scale.
For example:
Rate your satisfaction from 1 to 10.
Useful descriptive measures may include:
Mean
Median
Distribution
Frequency
Range
Do not report only the average if the distribution tells a substantially different story.
Demographic Questions
Demographic questions can help describe the survey sample or compare groups.
Examples include:
• Age group
• Year of study
• Major
• Employment status
• Education level
Students should be especially careful with privacy when handling demographic information.
Open-Ended Questions
Open-ended questions require qualitative interpretation.
AI can help categorize responses and identify recurring themes, but students should review the original answers.
Minority opinions and contradictory responses should remain visible when they are relevant to the research question.
Choosing the right analysis for each question is an important part of using the Best AI Tools for Students to Analyze Survey Data responsibly.
AI for Open-Ended Survey Responses
Open-ended questions can provide some of the most useful information in a survey, but they can also be one of the hardest parts to analyze manually.
Unlike multiple-choice questions, written responses rarely fit neatly into predefined categories.
One student may write a detailed paragraph. Another may answer with a single sentence. Some respondents may express similar ideas using completely different words.
AI can help organize this information, but the original responses should always remain the foundation of the analysis.
Categorization
AI can suggest categories based on recurring ideas in the responses.
For example, responses to a question about challenges with online learning might contain themes related to:
• Internet connectivity
• Lack of motivation
• Time management
• Distractions
• Difficulty communicating with instructors
These categories can provide a starting point for further analysis.
Students should review the original responses before accepting the categories.
Theme Identification
AI can identify recurring themes across large collections of written responses.
A useful workflow is:
Original Responses → AI-Suggested Themes → Student Review → Final Coding
This prevents the AI from becoming the sole decision-maker.
Sentiment Analysis Where Appropriate
AI can sometimes classify responses according to broad sentiment, such as positive, negative, or neutral.
However, sentiment should only be used when it actually answers the research question.
A positive or negative label may also oversimplify a response that contains mixed opinions.
Summarization
AI can summarize long groups of responses into concise descriptions.
For example, instead of reading a hundred similar comments repeatedly, a student might use AI to identify the main ideas and then inspect representative responses.
The summary should always be checked against the source responses.
Repeated Themes
Repeated themes can help students understand which issues appear most frequently.
However, frequency should not automatically determine importance.
A rare response can still be highly relevant to the research question.
Representative Response Selection
AI can help identify responses that illustrate a particular theme.
Students should verify that selected responses genuinely represent the category and follow any rules regarding quotations or participant privacy.
Protecting Minority and Contradictory Responses
One of the biggest risks of automated qualitative analysis is oversimplification.
If most respondents express one opinion but a smaller group disagrees, the minority perspective should not disappear simply because it is less common.
Students should inspect contradictory and unusual responses before finalizing their findings.
A responsible approach to AI-assisted survey analysis therefore treats AI-generated themes as provisional analytical suggestions, not final research conclusions.
AI for Survey Data Visualization
Good visualization can turn a confusing spreadsheet into a result that readers can understand quickly.
AI can help students decide which visualization may fit a particular question, generate charts from structured data where supported, and explain what a chart appears to show.
But the student must still verify that the visualization accurately represents the dataset.
Bar Charts
Bar charts are useful for comparing categories.
They work well for questions such as:
• Preferred study method
• Most common response
• Choice of learning platform
• Year of study
The categories should be clearly labeled, and the values should match the source data.
Pie Charts Where Appropriate
Pie charts can show how a whole is divided among a small number of categories.
They are most useful when the categories are limited and the proportions are easy to compare.
For many survey questions, a bar chart may communicate differences more clearly.
Histograms
Histograms can help display the distribution of numerical responses.
They may be useful for variables such as:
• Age
• Study hours
• Satisfaction scores
• Test scores
• Time spent on a task
The intervals, or bins, should be chosen appropriately.
Stacked Charts
Stacked charts can be useful when comparing response distributions across groups.
For example, a student could compare agreement levels between different years of study.
However, too many categories can make a stacked chart difficult to interpret.
Line Charts Where Relevant
Line charts are most appropriate when the data represents an ordered sequence, such as measurements collected over time.
They are generally less suitable for ordinary one-time categorical survey questions.
Tables
Sometimes a table is better than a chart.
Tables are particularly useful when readers need to see exact values rather than broad visual patterns.
For academic reports, a well-designed table can provide more precision than a decorative visualization.
Cross-Tab Visualizations
Cross-tabulation can help students compare two categorical variables.
For example:
Year of Study × Preferred Study Method
AI can help students explore these relationships and suggest visualization options.
The student should verify all counts and percentages before including the result in a report.
Question → Data Type → Appropriate Visualization
A simple decision process is:
What is the question?
↓
What type of data does it produce?
↓
What comparison or pattern matters?
↓
Which visualization communicates it most clearly?
This is better than choosing a chart simply because it looks attractive.
When students use the Best AI Tools for Students to Analyze Survey Data, visualization should make verified findings easier to understand—not make weak findings look more convincing.
AI for Survey Statistics
Statistics can help students summarize survey data, but the correct statistical method depends on the research question, survey design, and type of variables.
AI can be useful for explaining statistical concepts and assisting with calculations.
It should not be treated as an automatic statistical consultant.
Mean
The mean is the arithmetic average of numerical values.
It can provide a useful summary when the average is meaningful for the type of data being analyzed.
Students should also consider whether extreme values substantially affect the result.
Median
The median represents the middle value when observations are ordered.
It can be useful when data is skewed or contains extreme values.
Mode
The mode is the most frequently occurring value or category.
It can be particularly useful for categorical responses.
Percentages
Percentages make survey results easier to communicate.
For example:
72 out of 100 respondents selected Option A.
can be expressed as:
72% of respondents selected Option A.
Students should always verify both the numerator and denominator.
Frequencies
Frequency simply describes how often a response or category occurs.
A frequency table can provide a useful first look at survey results before more detailed analysis.
Standard Deviation
Standard deviation describes how spread out numerical observations are around their mean.
Students should understand what the measure represents before including it in a research report.
Cross-Tabulation
Cross-tabulation compares categories across two variables.
For example:
| Year | Prefer Online | Prefer In-Person |
|---|---|---|
| First Year | — | — |
| Second Year | — | — |
| Third Year | — | — |
| Fourth Year | — | — |
The actual values should always come from the student’s dataset.
Correlation Where Appropriate
Correlation describes an association between variables.
It does not automatically establish that one variable causes another.
For example, if students who study more hours also report higher confidence, the result does not by itself prove that additional study time caused the higher confidence.
Basic Significance Concepts Where Relevant
Some student projects may involve statistical significance.
However, significance testing should not be added simply because an AI tool recommends it.
Students should understand:
• The research question
• The variables
• The sample
• The selected statistical method
• The assumptions behind that method
• What the resulting statistic actually means
If the appropriate method is unclear, students should seek guidance from their instructor or a qualified research/statistics resource.
AI Can Calculate, But Students Must Understand
The central rule is simple:
AI can calculate or explain statistics, but students must understand which statistical method is appropriate for their research question and data.
A technically correct calculation can still be inappropriate if the wrong method was selected.
How to Verify AI-Generated Survey Analysis
Verification should not be treated as an optional final step.
It should be part of the analysis workflow from the beginning.
An AI-generated answer can sound confident even when a calculation, category, or interpretation is wrong.
Check the Original Data
Always return to the source dataset.
If AI says:
“Most respondents selected Option B.”
check the actual response counts.
If the AI’s statement does not match the dataset, do not use it.
Recalculate Important Numbers
Important statistics should be checked independently.
Verify:
• Counts
• Percentages
• Means
• Medians
• Standard deviations
• Group comparisons
A spreadsheet can be useful for independently checking AI-generated calculations.
Verify Percentages
Percentage errors can happen when AI uses the wrong denominator.
For example, a percentage might be calculated from all respondents when the question actually had several missing answers.
Always confirm:
Numerator ÷ Correct Denominator
Check Sample Size
Before reporting a percentage or statistical result, confirm the number of valid responses.
A statement based on 200 completed responses is different from one based on 37 valid responses.
The sample size should be clear wherever it matters to interpretation.
Check Units and Categories
Make sure AI did not accidentally combine categories that should remain separate.
Also check:
• Units
• Labels
• Response scales
• Category definitions
A small labeling mistake can change the meaning of a result.
Review AI-Identified Patterns
If AI says it found a trend, return to the dataset.
Ask:
• Is the pattern actually present?
• How large is the difference?
• Is it consistent?Could another factor explain it?
• Does the research design support the interpretation?
Check Outliers
Unusual values should be investigated rather than automatically removed.
An outlier might represent:
• A data-entry error
• A legitimate unusual response
• A participant with a different experience
Students should document any decision to exclude data according to their research requirements.
Confirm Statistical Methods
If AI recommends a statistical test, do not simply run it.
First determine whether the method fits:
• The research question
• Variable types
• Sample
• Study design
• Assumptions
Compare AI Output With the Source Dataset
The final verification principle is:
AI Output ↔ Original Dataset
Every important finding should be traceable back to the actual survey responses.
This is one of the most important principles behind the Best AI Tools for Students to Analyze Survey Data: a tool is useful only when its output can be checked against the evidence.
Privacy and Survey Data Safety
Survey datasets can contain information that participants did not intend to share publicly.
Before uploading any dataset to an AI service, students should consider whether the information contains identifying or sensitive details.
Participant Names
Remove participant names whenever they are not necessary for analysis.
Email Addresses
Email addresses should generally not be included in an AI analysis dataset unless there is a legitimate reason and appropriate authorization.
Student IDs
Student IDs can identify individuals and should be removed or anonymized where possible.
Contact Information
Phone numbers, addresses, social media accounts, and other contact information should not be uploaded unnecessarily.
Sensitive Demographic Information
Some demographic information may become sensitive when combined with other variables.
Students should minimize the personal information included in an analytical dataset.
Health Information
Survey responses involving health, medical history, mental health, or other sensitive subjects require particular care.
Do not upload sensitive information simply because an AI tool makes analysis convenient.
Private Research Responses
Unpublished research responses may contain information that participants expected to remain within a research project.
Students should follow their research protocol and institutional requirements before using external AI services.
Institutional Data
School, university, company, or research-institution data may be subject to additional policies.
Check the applicable rules before uploading it.
Sensitive Datasets
A safer workflow is:
Raw Dataset
↓
Remove Unnecessary Identifiers
↓
Create Anonymized Working Copy
↓
Analyze
↓
Verify
Students should also review the AI service’s current privacy controls and data-handling terms rather than assuming that every platform treats uploaded information the same way.
Privacy is therefore part of choosing the Best AI Tools for Students to Analyze Survey Data, not an afterthought.
Academic Integrity and Ethical AI Use
AI can make survey analysis faster, but efficiency should never come at the expense of research integrity.
The student remains responsible for ensuring that the final analysis accurately represents the collected data.
AI Can Help With
AI can reasonably assist with tasks such as:
• Data organization
• Explanation
• Visualization suggestions
• Basic calculations
• Statistical concepts
• Response categorization
• Writing clarity
• Reviewing student-created analysis
The exact level of permitted assistance depends on the assignment and institution.
AI Should NOT
AI should not be used to:
• Invent survey responses
• Create fake participants
• Change data to produce desired results
• Hide contradictory findings
• Fabricate statistical significance
• Invent research findings
• Remove inconvenient responses without justification
• Present unverified AI analysis as established research
If your hypothesis is not supported by the survey, that is a legitimate result.
The purpose of analysis is to understand what the evidence shows—not to force the evidence to support an expected answer.
The Student Remains Responsible
Students should be able to explain:
• How the data was collected
• How it was cleaned
• Which methods were used
• Why those methods were selected
• What the findings actually show
What limitations existAI can support those processes, but it cannot take responsibility for the final research.
Common Mistakes Students Make When Using AI for Survey Analysis
AI can make survey analysis faster, but using it without a clear process can create new problems. The biggest mistakes usually happen when students trust an AI-generated result without checking the underlying data.
Uploading Raw Personal Data Without Considering Privacy
Before uploading survey responses, remove information that is not necessary for analysis.
This may include:
When possible, work with an anonymized copy rather than the original dataset.
Trusting AI-Generated Statistics
An AI tool can produce a convincing-looking calculation that is nevertheless incorrect.
Important numbers should be checked independently using a spreadsheet, calculator, statistical software, or another appropriate method.
Always verify important calculations before treating them as research findings.
Asking AI to “Make the Results Significant”
This is one of the most serious mistakes a student can make.
If the actual survey does not support a statistically significant result, AI should not be instructed to change the analysis until it produces one.
The research question should guide the analysis—not the desired outcome.
Changing Data to Match a Hypothesis
Unexpected results are not automatically bad results.
Students should never alter legitimate survey responses simply because the results do not match their original hypothesis.
If the data contradicts the hypothesis, report that honestly and discuss possible explanations and limitations.
Ignoring Missing Values
Missing responses can affect percentages and other calculations.
Students should determine how incomplete responses are handled and document important decisions.
Using Inappropriate Charts
Not every dataset needs a pie chart.
Students should select visualizations based on the question and data type rather than appearance.
Confusing Correlation With Causation
If two survey variables appear related, that does not automatically mean one caused the other.
AI-generated explanations should be checked carefully for causal language.
Treating AI Summaries as Complete Analysis
A summary can make a dataset easier to understand, but it may leave out important details.
Students should return to the original responses when a finding matters.
Failing to Inspect Original Responses
This is especially important for open-ended questions.
AI may categorize responses incorrectly or overlook unusual but meaningful perspectives.
Using AI-Generated Findings Without Verification
Before a finding enters an academic report, trace it back to the dataset.
A good rule for the Best AI Tools for Students to Analyze Survey Data is simple: No important AI-generated finding should reach the final report without verification.
Myth vs Reality
AI can be extremely useful for survey analysis, but several misconceptions can lead students toward unreliable research practices.
| Myth | Reality |
|---|---|
| AI can analyze any survey perfectly | Analysis quality depends on the data, research question, and method |
| AI-generated statistics are always correct | Important calculations must be verified |
| AI can fix bad survey data | AI can identify potential problems, but students must decide how legitimate data should be handled |
| AI can decide what the results mean | Researchers must interpret findings in context |
| More responses automatically mean better research | Data quality, survey design, and sampling also matter |
| AI can make insignificant results significant | Ethical analysis must reflect the actual data |
| AI can replace statistical knowledge | Students still need to understand the methods they use |
| A polished chart proves a strong finding | Visualization improves communication but does not validate the underlying research |
The Key Principle
AI should make the analysis process more efficient—not make the research less honest.
A strong student workflow combines:
That principle should remain at the center of any survey project.
Traditional Survey Analysis vs AI-Assisted Survey Analysis
AI does not make traditional research skills unnecessary.
Instead, it can reduce some repetitive work while leaving important analytical decisions with the student.
Area Traditional Workflow AI-Assisted Workflow
| Area | Traditional Workflow | AI-Assisted Workflow |
|---|---|---|
| Data preparation | Manual spreadsheet work | Spreadsheet + AI assistance |
| Repetitive calculations | Manually performed | AI can assist, then results are checked |
| Visualization | Student creates charts | AI can suggest or assist with charts |
| Open-ended responses | Manual reading and coding | AI can suggest preliminary themes |
| Statistical explanation | Textbooks, instructor, software | AI can explain concepts alongside trusted resources |
| Interpretation | Student analyzes evidence | Student interprets AI-assisted analysis |
| Verification | Manual checking | Still required |
| Student responsibility | Essential | Still essential |
The difference is therefore not human analysis versus AI analysis.
It is:
Human research judgment + AI-assisted efficiency
A Balanced Approach
Students should continue developing core research skills even when using AI.
You should understand:
AI can help you work faster, but understanding the research remains your responsibility.
Complete AI Survey Analysis Workflow for Students
The complete workflow can be organized into a simple sequence:
Research Question
↓
Survey Design
↓
Data Collection
↓
Data Cleaning
↓
Exploratory Analysis
↓
Visualization
↓
Statistical Analysis
↓
Interpretation
↓
Verification
↓
Findings
↓
Final Report
Stage 1 — Research Question
Start with a clear question.
For example:
> “How do college students perceive the usefulness of AI study tools?”
The question determines what data you need and what type of analysis may be appropriate.
Stage 2 — Survey Design
Create questions that actually measure the concepts you want to study.
AI can help review wording or identify ambiguity, but the final survey design should reflect the research objective.
Stage 3 — Data Collection
Collect genuine responses.
Do not create artificial responses simply to increase the dataset size or produce a desired outcome.
Stage 4 — Data Cleaning
Preserve the raw dataset.
Create a separate working copy where you can identify:
• Missing values
• Duplicate records
• Inconsistent categories
• Invalid entries
Stage 5 — Exploratory Analysis
Start by understanding what the dataset contains.
Review:
• Frequencies
• Percentages
• Distributions
• Basic descriptive statistics
AI can help summarize the initial results.
Stage 6 — Visualization
Create charts and tables that answer useful research questions.
Do not create visualizations simply to make the report look more impressive.
Stage 7 — Statistical Analysis
Choose methods appropriate to the research question and data.
For simple student projects, descriptive statistics may be enough.
More advanced projects may require additional statistical methods.
Stage 8 — Interpretation
Ask what the results actually show.
Separate observations from explanations.
For example:
Observation: Students who reported using study-planning tools frequently also reported higher satisfaction.
The second statement requires evidence that the survey may not provide.
Stage 9 — Verification
Check important AI outputs against the source dataset.
Recalculate important numbers and review analytical decisions.
Stage 10 — Findings
Write findings based on verified results.
AI can help improve clarity, but it should not invent findings.
Stage 11 — Final Report
Bring together:
• Methodology
• Results
• Charts
• Statistical analysis
• Interpretation
• Limitations
• Findings
Review the entire report before submission.
This complete process is the foundation of a responsible AI survey data analysis workflow.
AI Survey Analysis Prompts for Students
Good prompts make AI’s role more controlled and easier to verify.
Students should tell the tool exactly what data it should use and what it must not do.
These prompts are designed to keep AI focused on specific, verifiable survey-analysis tasks rather than giving it unrestricted control over the research process.
Prompt 1 — Organizing Survey Data
“Review this survey dataset and describe how the columns and response categories are organized. Do not change or invent any data. Identify inconsistencies that may require my review.”
Prompt 2 — Identifying Missing Values
“Identify missing or blank responses in this dataset. Report where they occur and how many there are. Do not remove, replace, or invent any values.”
Prompt 3 — Summarizing Response Distributions
“Calculate the frequency and percentage for each response category using only the supplied data. Show the denominator used for each percentage and flag any missing responses.”
Prompt 4 — Analyzing Likert-Scale Responses
“Summarize the distribution of these Likert-scale responses. Report the frequency and percentage for each category. Do not assume that the scale measures anything beyond the information provided.”
Prompt 5 — Categorizing Open-Ended Responses
“Group these open-ended responses into preliminary themes. Preserve minority and contradictory responses. Do not invent responses or force comments into categories that do not fit. Show examples from the provided responses where appropriate.”
Prompt 6 — Finding Recurring Themes
“Identify recurring themes in these survey responses. Rank themes by frequency only if the data supports that calculation. Distinguish frequent themes from potentially important but less common responses.”
Prompt 7 — Suggesting Appropriate Charts
“Review these survey variables and recommend an appropriate visualization for each. Explain why the chart fits the data type and research question. Do not recommend a chart simply because it looks attractive.”
Prompt 8 — Explaining Basic Statistics
“Explain the meaning of these statistical results in beginner-friendly language. Use only the calculations provided. Do not infer causation or create conclusions that are not supported by the data.”
Prompt 9 — Checking Calculations
“Check these survey calculations against the supplied values. Identify any arithmetic or percentage errors and show which numbers need verification. Do not silently correct the dataset.”
Prompt 10 — Reviewing the Final Analysis
“Review my survey analysis for logical consistency. Check whether the findings match the provided data, whether the statistical methods appear appropriate, and whether any claims overstate the evidence. Do not invent alternative findings.”
These prompts make the role of AI much clearer and reduce the risk of asking a tool to make unsupported research decisions. For students building the Best AI Tools for Students to Analyze Survey Data workflow, prompt design is just as important as tool selection.
Expert Tips for Better Survey Analysis
Start With the Research Question
Do not begin by asking:
Begin with:
This keeps the analysis focused.
Keep Raw Data Unchanged
Always preserve the original survey export. Perform cleaning and transformations on a separate working copy.
Work From a Copy When Cleaning Data
A working copy allows you to experiment without permanently changing your source data. This is especially important when AI is helping identify possible corrections.
Anonymize Sensitive Information
Remove unnecessary personal information before using an external AI service.
Use AI for Repetitive Work
AI is particularly valuable when it helps with repetitive tasks such as:
- Summarization
- Categorization
- Explanations
- Preliminary pattern identification
Verify Important Calculations
Do not assume an AI-generated percentage or statistic is correct. Check important numbers independently.
Inspect Original Responses
For qualitative analysis, always return to the original comments.
Do Not Cherry-Pick Findings
Do not report only the results that support your hypothesis. Unexpected findings are part of research.
Distinguish Correlation From Causation
Use careful language when describing relationships between variables.
Report Unexpected Results Honestly
A result that contradicts your expectation can still be valuable. Explain what the data shows rather than trying to make it fit the hypothesis.
Keep a Record of Methodology
Document important decisions such as:
- How data was cleaned
- Which categories were combined
- Which statistical methods were used
- How open-ended responses were coded
- How AI was used
This can make your research process easier to explain and reproduce.
Follow Instructor and Research Requirements
Course rules, institutional requirements, and research protocols should take priority over convenience.
The strongest Best AI Tools for Students to Analyze Survey Data workflow is one that remains transparent from the original response through the final finding.
Survey Analysis Checklist
Before submitting a survey-based assignment or research report, work through this checklist.
Data
Analysis
Findings
Academic and Ethical Review
A checklist like this is useful because AI-assisted analysis can produce polished output very quickly. A final human review helps ensure that polished output is also trustworthy.
Conclusion
AI can reduce much of the repetitive work involved in survey analysis.
It can help students organize responses, identify possible data problems, summarize open-ended answers, calculate basic statistics, create visualizations, explain analytical concepts, and turn verified findings into clearer academic writing.
But there is no single tool that is best for every project.
The Best AI Tools for Students to Analyze Survey Data depend on the task.
A spreadsheet may be the best foundation for preserving and checking the dataset. A general AI assistant can help explain patterns and statistics. Another tool may be more useful for qualitative responses or research context.
The most important part is not the tool itself.
It is the workflow.
Research Question
↓
Actual Survey Data
↓
Data Cleaning
↓
Analysis
↓
Visualization
↓
Verification
↓
Findings
The student remains responsible for every important research decision.
Do not invent responses. Do not alter legitimate data to produce a preferred result. Do not hide contradictory findings. Do not treat an AI-generated statistic as correct simply because it sounds confident.
Instead, use AI where it provides genuine assistance, verify important outputs against the original dataset, and report what the evidence actually shows.
When used responsibly, the Best AI Tools for Students to Analyze Survey Data can make student research more efficient without replacing the judgment, transparency, and critical thinking that good research requires.
Start with your question. Work from your real data. Use AI carefully. Verify everything important. Then write the findings.
Continue Learning
If you’re building a broader AI-assisted academic workflow, explore these related IndiaAITools guides:
AI Tools for Reading PDFs for Students
Understand textbooks, research papers, and academic PDFs more efficiently.
Explore Guide →Best AI Tools for Academic Research for Students
Find and organize academic information for assignments and research.
Explore Guide →Best AI Note-Taking Apps for College Students
Explore additional ways to organize and review your study notes.
Explore Guide →AI Tools for Group Project Collaboration for Students
Manage team assignments, shared tasks, and project workflows.
Explore Guide →Best AI Tools for Literature Review for Students
Organize research papers and make literature reviews easier to manage.
Explore Guide →AI Tools for Scholarship Search for Students
Discover AI-assisted ways to find and organize scholarship opportunities.
Explore Guide →These resources can help you move from research and data collection → analysis → visualization → academic writing → verification.
Frequently Asked Questions
What is the best AI tool for survey analysis?
There is no single best tool for every survey. ChatGPT, Gemini, Claude, Excel, and Google Sheets can each support different parts of the process. The right choice depends on your dataset, research question, analysis requirements, and level of statistical knowledge.
Can AI analyze survey responses?
Yes. AI can assist with structured survey data and open-ended responses by summarizing information, identifying potential patterns, organizing categories, and explaining basic statistics. Important results should always be checked against the original dataset.
Can AI create charts from survey data?
Some AI-enabled tools can assist with creating or recommending charts from structured data. Students should still verify the values, labels, categories, and chart type before using a visualization in an academic report.
Can AI analyze open-ended survey responses?
Yes. AI can help categorize responses, identify recurring themes, and summarize large collections of written answers. Students should review the original responses to make sure important minority or contradictory viewpoints are not lost.
Can AI analyze Likert-scale survey data?
AI can help summarize Likert-scale responses and explain basic analytical concepts. However, the appropriate statistical treatment depends on the research question, scale, study design, and methodology.
Can AI calculate survey statistics?
AI can assist with calculations such as frequencies, percentages, means, medians, and standard deviations. Important calculations should be independently verified because AI outputs can contain errors.
Can Excel or Google Sheets be used with AI for survey analysis?
Yes. Spreadsheets are useful for organizing, inspecting, calculating, and visualizing survey data, while AI can provide additional assistance with explanations, formulas, summaries, or exploratory analysis depending on the available features.
Is it safe to upload survey data to an AI tool?
It depends on the information and the tool’s current privacy and data-handling practices. Students should remove unnecessary identifying information, review relevant privacy settings, and follow institutional or research requirements before uploading survey data.
Is using AI for survey analysis allowed in academic research?
It depends on the course, institution, research project, and applicable rules. Students should follow their instructor’s or institution’s AI policy and disclose AI assistance when required.
How can I verify AI-generated survey analysis?
Compare the output with the original dataset, recalculate important numbers, check sample sizes and percentages, review AI-generated themes, confirm statistical methods, and make sure the final findings do not go beyond the evidence.
The Student Survey Analysis Blueprint
The IndiaAITools approach can be summarized in nine stages:
Question
Start with the research question.
Do not begin with the AI tool. The question determines what data matters and what analysis may be appropriate.
Collect
Gather actual survey responses.
Never create artificial responses simply to make the dataset larger or easier to analyze.
Clean
Identify:
- Missing responses
- Duplicate records
- Inconsistent categories
- Invalid entries
Keep the original dataset unchanged.
Understand
Use AI to summarize distributions, organize responses, and identify potential patterns.
Treat these outputs as exploratory assistance.
Visualize
Create charts and tables that communicate the important characteristics of the data.
Choose visualizations based on the data type and research question.
Analyze
Apply suitable statistical methods.
Do not select a method simply because an AI tool suggests it.
Verify
Compare AI output against the original dataset.
Check important calculations, categories, sample sizes, patterns, and statistical interpretations.
Explain
Turn verified findings into clear academic language.
AI can help improve readability, but it should not add unsupported conclusions.
Report
Present the results honestly.
Include relevant limitations and explain the methodology clearly.
Final Principle
AI can accelerate the workflow. The student owns the research.
That is the core of the IndiaAITools Student Survey Analysis Blueprint and the foundation of responsible AI-assisted survey research.